In this section, I’m going to cover the mechanics of disassembling some firmware and how to go about understanding it.
The VT100 firmware is in four ROMs, each 2 KiB long, for a total of 8 KiB. There are plenty of dumps of these images around, and I acquired mine from a site containing ROMs for the MAME emulator.
The DEC part numbers from the latest available version of the VT100 print set, and the ROMs themselves, are:
These can be concatenated, in that order, to produce the full 8 KiB of executable code, which I have unimaginatively called vt100.bin. (SHA1: 69efed3cfd20b9c1f65e3fd706e4a36a882cee64)
I picked Jeffery Post’s D52 disassembler for this project. I was attracted by the possibility of using the same tool on later projects, if I chose to look at the VT102 (Intel 8085) or VT320 (Intel 8051 family) firmware. A particularly useful feature of this disassembler, which I didn’t appreciate until I’d seen the output, was the inclusion of comments on every line containing the ASCII representations of the bytes for that line. More on this later.
Because my annotations are being made on the disassembled file, changing labels, perhaps changing some disassembled instructions into data, etc., I also need an assembler, so I can rebuild a binary and compare it with the original. More than once, I fat-fingered some editing and ended up with a binary mismatch and had to backtrack.
The assembler I’m using is Jay Cotton and Claude Sylvain’s asm8080, which was originally developed on SourceForge but I’ve picked Alexander Demin’s GitHub import.
As for documentation, we are lucky that the VT100 User Guide, Technical Manual and Print Set are available online. The Technical Manual is superb, covering not only all the major hardware blocks but also describing in good detail the firmware. From the point of view of a nosey software engineer who’s examining the firmware, there are some odd omissions, such as missing details of individual bits in the flags buffer and modem status, but these are all cleared up easily by looking at the print set.
I started off by using the PDF of the Technical Manual from Bitsavers but decided to transcribe it for simple online use and correct typographical errors as I went along. This version of the Technical Manual is still a work in progress but the most important chapter, Chapter 4: Technical Description, is done. The annotated disassembly links to this document.
The command dz80 -80 -D vt100.bin produces the initial version of the disassembly, in a file called vt100.d80,
which I renamed to vt100.asm in order to get decent highlighting in Vim.
This disassembly contains 8080 mnemonics, as the VT100 uses an 8080 processor. I did wonder whether to disassemble in Z80 mnemonics, because that’s where I started, 40 years ago. After years of poring over the mnemonics in the back of the Sinclair ZX Spectrum manual, I can assemble and disassemble Z80 programs in my head. However, because Zilog considerably enlarged the instruction set, there would be more of a chance of data being erroneously interpreted as instructions and I also thought, how hard can it be to learn a new set of mnemonics?
And the answer came quickly: not hard, just tedious! When you’ve seen the two side by side, you begin to appreciate
just how much work Zilog put into cleaning up the mnemonics. I was initially a bit blind to the difference between
inr h and inx h, being used to seeing HL for word-wise operations. And don’t even get me started on
jp versus jmp. Overall, the 8080 mnemonics are dishearteningly arbitrary but I stuck with them.
So, you’ve run the disassembler and you’ve got 5000 lines of assembler, starting with:
        org     0
;
X0000:  di                      ; 0000  f3              s
        lxi     sp,X204e        ; 0001  31 4e 20        1N
        jmp     X003b           ; 0004  c3 3b 00        C;.
;
        org     8
;
X0008:  call    X00fd           ; 0008  cd fd 00        M}.
        ei                      ; 000b  fb              {
        ret                     ; 000c  c9              I
First, the good news. The ROMs have been joined in the right order. An 8080 starts execution at address 0, where you normally have only eight bytes available before you head into interrupt vectors, so the sensible thing to do is disable interrupts, initialise the stack pointer, and jump to somewhere with more room. Job done.
The bad news? Every location that the disassembler identifies as the target of a jump, or call, or even 16-bit values loaded
into one of the register pairs, gets a label, Xhex. All 500-or-so labels need to be given proper names as
the code is interpreted. Also, those comments need to be replaced with something meaningful.
As motivation, I made a little script that fired whenever I saved the assembler from my editor, and it performed the assembly, checked the binary output against the pristine ROM image and reported statistics of how far I’d got through. The first report looked like this:
0 TODO, 535 Xlabels (0% done), 176 xlocs (0% done), 4477 lines untouched (0% done), 111% commented
Two months later (early February 2022), it’s looking better:
Files VT100.orig.bin and VT100.final.bin are identical
  19 TODO,    0 Xlabels (100% done),    1 xlocs (99% done),   29 lines untouched (99% done), 139% commented
As I work through the code, any questions that occur to me get entered as TODO items, in the comments. These TODOs might be any of the following:
There were more than 50 at one point. If I was unsure where to start on any given day, I’d review the existing TODOs and see if any were worth tackling.
That “lines untouched” statistic is the number of lines in the listing that still contain hex comments. Sometimes, I will start reading and commenting a large routine, skip a bit that isn’t obvious (perhaps references to a number of undeciphered data locations) and continue below. On a casual perusal of the listing, they might not stand out amidst the wonderful literary achievements(!) of the surrounding lines, so it is good to have a hint that I’ve not finished yet. And that “139% commented” is just a booster for me, to show that I’ve written more than single line expositions and might actually have increased the value of the listing by writing explanations of major functions, with entry and exit criteria.
So, how to approach this? The natural answer might seem that you start at the beginning and follow the thread of execution, annotating as you go. The Technical Manual’s description of the firmware provides a head start in doing this, but there are some natural limits. Firstly, the code will be using data in locations that you haven’t deciphered yet, so writing a meaningful annotation will be impossible. Secondly, the terminal doesn’t actually do very much without external stimuli. In the absence of serial data from a host computer or key presses, the execution quickly settles into an idle loop.
The approach I adopted was very much more, “hunt and peck!” The disassembly shows a number of sections that seem to be data
structures and one of them I recognised from the ASCII data in the comments as seeming to list the final characters of escape
sequences, so I quickly structured this into a table containing final characters and address of routines that, I guessed, would
execute those sequences. There were a number of tables of this form in the code. The User Manual tells you exactly what any
given escape sequence does, so that rapidly gives you a meaning for data locations. You now have an entry point and a number of
data locations whose names can be changed from Xhex to something better, with comments that explain your
level of certainty over these assigned names.
I quickly found that there is a limit to the understanding that can be gained by simply reading a listing. Too many questions along the lines of “is it really doing what I think it’s doing?” pile up, along with clear indications that the ‘main’ thread of execution you’re pursuing is now waiting on some asynchronous event, and you’re going to have to dive into the interrupt handling.
Many of these questions can be answered by actually running the code. My VT100 is gathering dust (and possibly worse) in box number 137 since our last house move, cough years ago. So I needed an emulator.
My first port of call was MAME, because that’s where I’d found the ROMs. It had completely escaped my attention that MAME had merged with the MESS project some years ago, expanding the scope beyond emulation of arcade games to now cover all manner of retro-computing goodies.
Firing up the VT100 emulator was quick, easy and very rewarding. Chunky key clicks and bell sounds tickled my memory as I typed random keys and visited the VT100’s minimalist SET-UP menu for the first time in, ooh, 20 years?
The second surprise was discovering that MAME had a debugger, and what a debugger. Real-time scrolling through a disassembly, memory windows, break points and traces were a joy to use and answered many questions as fast as I could type breakpoint addresses in and hit “Run.”
‘Screwtape’ has even documented how to connect MAME’s VT102 emulator to a serial port, on a web page that is as charmingly yellowed as most of my real terminals.
The only feature of a VT100 that I noticed to be missing from MAME is smooth scrolling, which was a shame as that was my primary question about interplay between the ‘main’ thread of execution and the vertical blank interrupt handler. With smooth scrolling, you hit a point in the main code where a tight loop just waits for some value to change in RAM. At this point, you need to examine the vertical interrupt handler.
I also had a play with Jeff Parsons’s PCjs Emulation of the VT100. This is a lot of fun, though I didn’t experiment for long because I kept hitting limitations of the keyboard, with the emulation running in a browser. With MAME being a full application, it felt more like using the real machine. However, kudos to Jeff for running the real firmware in his JavaScript 8080 emulator.
After a few weeks of work, my statistics were looking good; the numbers of TODOs was on the way down and nearly every location in RAM had been given a name that at least matched all usages that I’d identified. There were still some oddities: locations for which I could only find writes, and some that didn’t seem to be written at all.
I wanted to know for sure whether these locations were used. Running targeted test scenarios with MAME wasn’t producing results. One of the tricky things about reverse-engineering assembler is that locations that you’ve named aren’t always referred to by those names in the code. If you’ve set up a pointer to a location in a register, you have a name for that location. A few increments down the line and you’re accessing other locations without naming them. Of course, you’d expect this to happen if you’re iterating over a list of similar things, but it’s a common enough technique to go on to use the same register pointer to access unrelated values that just happen to be nearby. I call these accesses ‘stealth reads’ and ‘stealth writes.’ To track these down I needed a coverage checker.
A what, now? A coverage checker for the 8080 processor? That’d be niche. In fact, if one exists already, my Google-fu is shot. So I wrote one.
By a ‘coverage checker,’ I mean this. I want a tool that will take my firmware image and run it, recording:
The first point is important because I’m only going to know how the program accesses memory if I’ve run every path through the code. And I’m only going to be able to do that if my coverage checker is part of a fully-grown emulator that I can stimulate with key presses and serial bytes.
The starting point for my coverage checker, which I’m calling Awnty for (whistles) no particular reason, needs to be an 8080 engine that I can easily modify. Candidate languages for Awnty could be Perl, C or C++. MAME is written in C++, but I really wanted something smaller that I could grok in about four minutes thirty-three seconds, and then get hacking.
I downloaded 8080 by Nicolas Allemand, which is a tiny emulator in C99. A quick perusal of the code didn’t produce any gagging reaction, so I decided to trust that its 8080 heart was pure and build on it.
I’ll talk more about Awnty elsewhere but, in short, it reads a command file that injects a set of serial bytes or key presses, at a defined pace, into the running VT100 emulator. The results of running that test are recorded on a coverage map. I developed tests to exercise all of SET-UP by injecting key presses and most of the other terminal’s functionality by passing in serial bytes as if a host computer had sent them. Bytes transmitted to the host computer are logged, just to reassure myself that the emulator was doing the right thing, but they aren’t relevant to coverage.
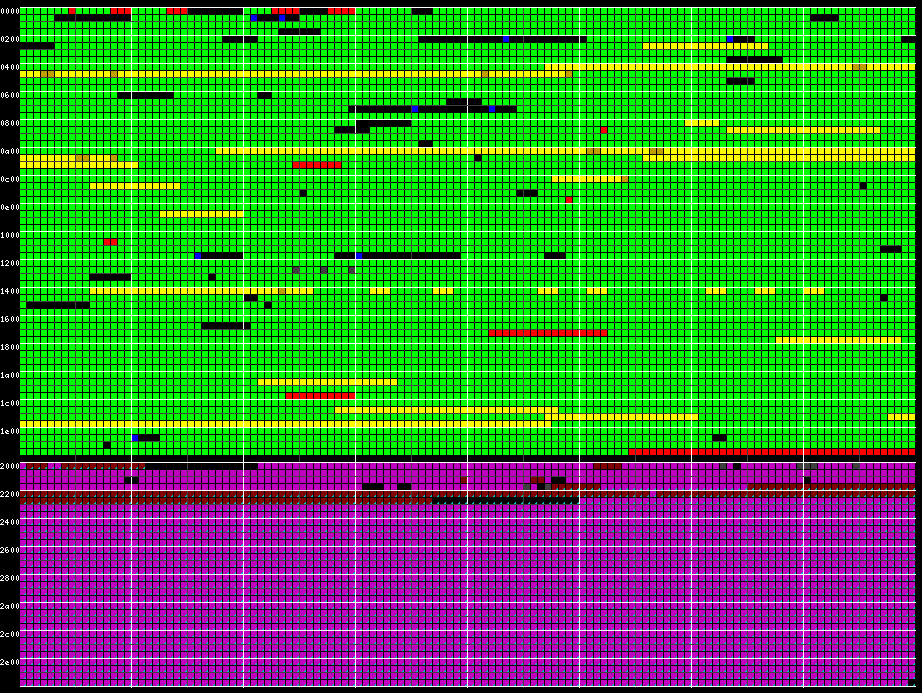
When individual tests are working, they are concatenated into one big test, which currently takes the terminal over five minutes to crunch, and outputs a coverage map like this:
The top two thirds, mostly in green, is the ROM. The bottom third is the 3 KiB of RAM that a stock VT100 has.
For the ROM, data structures are marked, by me, in dull yellow. When they are read, they turn bright yellow. Green indicates that the byte was executed as part of an instruction. Black sections weren’t executed. Red sections are marked by me as unreachable and Awnty will confirm or disprove that. At the end of execution, Awnty takes the current symbol table from the disassembly and overlays blue marks on unexecuted (black) sections to guide me in writing tests to cover them. In one case, a section was stubbornly remaining black despite many attempts to construct a test case to cover it. In the end, I realised that there was a bug which made that section unreachable. I had been reading the code for hours without spotting it.
For the RAM, magenta marks locations that are read and written to by the CPU. Small cyan triangles show the path of the DMA engine; these locations are the video RAM, which is dynamically re-structured by the VT100 firmware depending on mode, hence the discontinuity. Again, black sections are neither read nor written. The first black section is the unused stack space. 22 of the available 31 16-bit words are used while exercising every terminal function. At a guess, if you were developing firmware for a device like this, you’d place a canary in RAM to test your assumption about required stack space.
The above coverage map has taken me as far as it needs to. The remaining black sections in ROM are trivially analysable without needing to construct more test cases.